Datasets
SYNTHETIC DATA. Every table on this page was invented for illustration. It describes no real person, firm or market, and nothing here is a real-world statistic.
Dataset 1: sample payment histories
| Applicant | Rent paid on time (of 12) | Utilities paid on time (of 12) | Failed subscription payments |
|---|---|---|---|
| A-001 | 12 | 12 | 0 |
| A-002 | 11 | 12 | 1 |
| A-003 | 8 | 9 | 3 |
| A-004 | 12 | 10 | 0 |
| A-005 | 5 | 7 | 5 |
| A-006 | 9 | 11 | 2 |
| A-007 | 12 | 6 | 1 |
| A-008 | 3 | 4 | 6 |
What the columns mean
- Applicant: an invented identifier, not a real person.
- Rent paid on time (of 12): the number of the last 12 monthly rent payments made on or before the due date.
- Utilities paid on time (of 12): the same measure for utility bills.
- Failed subscription payments: how many recurring payments failed in the same 12 months.
Dataset 2: the toy scoring rule
| Item | Points | Meaning |
|---|---|---|
| Starting score | 500 | Everyone begins here. |
| Each month of rent paid on time | +10 | Up to 12 months, so up to +120. |
| Each month of utilities paid on time | +5 | Up to 12 months, so up to +60. |
| Each failed subscription payment | -8 | Subtracted once per failed payment. |
Dataset 3: example scores and bands
| Applicant | Rent on time | Utilities on time | Failed subscriptions | Score | Band |
|---|---|---|---|---|---|
| A-001 | 12 | 12 | 0 | 680 | Higher |
| A-002 | 11 | 12 | 1 | 662 | Higher |
| A-003 | 8 | 9 | 3 | 601 | Medium |
| A-004 | 12 | 10 | 0 | 670 | Higher |
| A-005 | 5 | 7 | 5 | 545 | Lower |
| A-006 | 9 | 11 | 2 | 629 | Medium |
| A-007 | 12 | 6 | 1 | 642 | Medium |
| A-008 | 3 | 4 | 6 | 502 | Lower |
How the bands are used in this illustration
- Higher: a score of 650 or more. In the illustration, a reviewer would still confirm the data.
- Medium: 600 to 649. The illustration treats these as cases where a person looks at the full picture.
- Lower: below 600. The illustration sends these to human review, and the score is not a decision to decline.
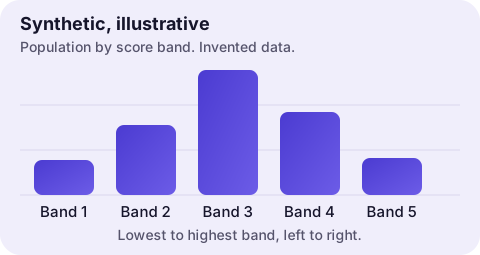
A picture of a synthetic population
How these tables fit together
Dataset 1 holds the records, Dataset 2 holds the rule, and Dataset 3 shows the result of applying the rule to the records. Changing the rule or the records changes the scores, which is the point: the output depends on choices people made.
The How it works page explains the steps and the cautions. This is a toy example and has not been validated.